System frequently stops responding...

Hello, Run into an issue today, which digging in the logs seems to have going on for a while, but somehow became extreme today... Not sure yet what the root cause is.. might not be FreeRADIUS. I have four instances of 3.0.8, running in containers, two per VM. a load balancer routes traffic to the nodes, with username based persistence. We have several Cisco wireless controllers that use this RAIDUS setup.... very frequently, they have been logging that the RADIUS server failed to respond, and log the user name and the station id. I tracked lots of such instances, and found the packets do arrive at the VMs, but no reply is sent out. Sometime later system would respond fine to some other incoming packets! I find nothing in the logs related the failed requests, not from FreeRADIUS and not from iptables... The load on the VMs is constantly close to 0. No RAM issues or any other issues I could see... I doubled the number of FreeRADIUS instances anyway... but the issue persisted. the Cisco's log the errors many times per minute.... I restarted the FreeRADIUS instances few times... to no avail. But then decided to reboot both VMs... and issue seems to have disappeared! At least for now. the uptime on the VMs was 92 days. they are redhat 6.6. any suggestions on how to further debug such behavior, if it were to start again? Thanks a lot, Mohamed.

Turn on debugging on the freeradius server. Either fully or use radmin to turn on debug for one controller or one user-name that is failing to connect alan
Thanks Alan.. I ll check out radmin. BTW, the man page says: debug condition '((User-Name == bob) || (Packet-Src-IP-Address == 1922))' A more complex condition that enables debugging output for requests containing User-Name "bob", or requests that originate from source IP address 1922. What's that address of 1922? Thanks, Mohamed. On Fri, Jun 26, 2015 at 4:29 AM, Alan Buxey <A.L.M.Buxey@lboro.ac.uk> wrote:
Turn on debugging on the freeradius server. Either fully or use radmin to turn on debug for one controller or one user-name that is failing to connect
alan
Hi,
BTW, the man page says:
debug condition '((User-Name == bob) || (Packet-Src-IP-Address == 1922))' A more complex condition that enables debugging output for requests containing User-Name "bob", or requests that originate from source IP address 1922.
What's that address of 1922?
umm.. not whats in the radmin man page the actual text says Packet-Src-IP-Address == 192.0.2.22 which I think makes this quite sensible....debug for user-name of Bob if the client has address 192.0.2.22 :-) alan
Weird... both my chrome and Firefox show 1922, even in view source HTML mode: <dt>debug condition '((User-Name == bob) || (Packet-Src-IP-Address == 1922))'</dt> This is from: http://freeradius.org/radiusd/man/radmin.html On Fri, Jun 26, 2015 at 12:05 PM, <A.L.M.Buxey@lboro.ac.uk> wrote:
Hi,
BTW, the man page says:
debug condition '((User-Name == bob) || (Packet-Src-IP-Address == 1922))' A more complex condition that enables debugging output for requests containing User-Name "bob", or requests that originate from source IP address 1922.
What's that address of 1922?
umm.. not whats in the radmin man page
the actual text says Packet-Src-IP-Address == 192.0.2.22
which I think makes this quite sensible....debug for user-name of Bob if the client has address 192.0.2.22 :-)
alan - List info/subscribe/unsubscribe? See http://www.freeradius.org/list/users.html
Oh wait.. you meant the man page, that thing in the ASCII terminal :) On Fri, Jun 26, 2015 at 6:35 PM, Mohamed Lrhazi < Mohamed.Lrhazi@georgetown.edu> wrote:
Weird... both my chrome and Firefox show 1922, even in view source HTML mode:
<dt>debug condition '((User-Name == bob) || (Packet-Src-IP-Address == 1922))'</dt>
This is from: http://freeradius.org/radiusd/man/radmin.html
On Fri, Jun 26, 2015 at 12:05 PM, <A.L.M.Buxey@lboro.ac.uk> wrote:
Hi,
BTW, the man page says:
debug condition '((User-Name == bob) || (Packet-Src-IP-Address == 1922))' A more complex condition that enables debugging output for requests containing User-Name "bob", or requests that originate from source IP address 1922.
What's that address of 1922?
umm.. not whats in the radmin man page
the actual text says Packet-Src-IP-Address == 192.0.2.22
which I think makes this quite sensible....debug for user-name of Bob if the client has address 192.0.2.22 :-)
alan - List info/subscribe/unsubscribe? See http://www.freeradius.org/list/users.html
Hello all, Still still trying to get to the bottom of this issue... to summarize: - Wireless controllers log that RADIUS server (a load balanced VIP), did not respond to a query. this is logged in clusters of dozen or so, several times a day. - Using docker containers.. so decided to try without them - Built two VMs, RedHat Enterprise 7, running provided freeradius RPMs. 3.0.4 - Sending the quarter of our traffic to this pool of two VMs. - Issue still occurs on these VMs. - I run radiusd in -Xx mode, on both of the RHEL7 VMs, also run a continuous tcdpump, on each VM. - Problem occurrences seem to reliably coincide with: -- tcpdump shows all the requests logged by the controllers having been resent few times (duplicates in wireshark). -- radiusd goes silent (no log at all) for 30 seconds. after which it resumes logging and I presume, working. - radiusd logs a line for each missed query, I think, like so: Error: (7719) Ignoring duplicate packet from client gu_net_10 port 3010 - ID: 96 due to unfinished request in component <core> module -- Spikes in CPU usage (as seen in sar output). What can I do next? to further zoom in on the root cause? Or is this pretty clearly CPU starvation? just add more VMs ? Thanks a lot, Mohamed. On Fri, Jun 26, 2015 at 6:36 PM, Mohamed Lrhazi < Mohamed.Lrhazi@georgetown.edu> wrote:
Oh wait.. you meant the man page, that thing in the ASCII terminal :)
On Fri, Jun 26, 2015 at 6:35 PM, Mohamed Lrhazi < Mohamed.Lrhazi@georgetown.edu> wrote:
Weird... both my chrome and Firefox show 1922, even in view source HTML mode:
<dt>debug condition '((User-Name == bob) || (Packet-Src-IP-Address == 1922))'</dt>
This is from: http://freeradius.org/radiusd/man/radmin.html
On Fri, Jun 26, 2015 at 12:05 PM, <A.L.M.Buxey@lboro.ac.uk> wrote:
Hi,
BTW, the man page says:
debug condition '((User-Name == bob) || (Packet-Src-IP-Address == 1922))' A more complex condition that enables debugging output for requests containing User-Name "bob", or requests that originate from source IP address 1922.
What's that address of 1922?
umm.. not whats in the radmin man page
the actual text says Packet-Src-IP-Address == 192.0.2.22
which I think makes this quite sensible....debug for user-name of Bob if the client has address 192.0.2.22 :-)
alan - List info/subscribe/unsubscribe? See http://www.freeradius.org/list/users.html

On 24 Jul 2015, at 07:34, Mohamed Lrhazi <Mohamed.Lrhazi@georgetown.edu> wrote:
What can I do next? to further zoom in on the root cause? Or is this pretty clearly CPU starvation? just add more VMs ?
It doesn’t sound like CPU starvation… what is the load average before/while/after this is going on (and how many CPU’s does the guest have)? What state is the radius process in when it is frozen (ps aux | grep radiusd, look at the STAT column). Run freeradius under strace (strace -Ff <radius command>). Is it waiting on a syscall? Which? Does FreeRADIUS respond to radmin commands while it is seemingly frozen? What hypervisor is in use? Regards, Adam Bishop gpg: 0x6609D460 jisc.ac.uk Jisc is a registered charity (number 1149740) and a company limited by guarantee which is registered in England under Company No. 5747339, VAT No. GB 197 0632 86. Jisc’s registered office is: One Castlepark, Tower Hill, Bristol, BS2 0JA. T 0203 697 5800. Jisc Services Limited is a wholly owned Jisc subsidiary and a company limited by guarantee which is registered in England under company number 2881024, VAT number GB 197 0632 86. The registered office is: One Castle Park, Tower Hill, Bristol BS2 0JA. T 0203 697 5800.

On Jul 24, 2015, at 1:34 AM, Mohamed Lrhazi <Mohamed.Lrhazi@georgetown.edu> wrote:
Still still trying to get to the bottom of this issue... to summarize: - Wireless controllers log that RADIUS server (a load balanced VIP), did not respond to a query. this is logged in clusters of dozen or so, several times a day. - Using docker containers.. so decided to try without them - Built two VMs, RedHat Enterprise 7, running provided freeradius RPMs. 3.0.4
Please use 3.0.9. We're not going to debug issues which were tracked down and fixed six months ago.
- Sending the quarter of our traffic to this pool of two VMs. - Issue still occurs on these VMs. - I run radiusd in -Xx mode, on both of the RHEL7 VMs, also run a continuous tcdpump, on each VM.
- Problem occurrences seem to reliably coincide with: -- tcpdump shows all the requests logged by the controllers having been resent few times (duplicates in wireshark). -- radiusd goes silent (no log at all) for 30 seconds. after which it resumes logging and I presume, working.
And.... what does the debug log say during this time? You should be able to correlate timestamps. If there's *nothing* in the debug output, then most likely is that database is locking up, and preventing FreeRADIUS from doing anything
- radiusd logs a line for each missed query, I think, like so: Error: (7719) Ignoring duplicate packet from client gu_net_10 port 3010 - ID: 96 due to unfinished request in component <core> module
-- Spikes in CPU usage (as seen in sar output).
What can I do next? to further zoom in on the root cause? Or is this pretty clearly CPU starvation? just add more VMs ?
Use 3.0.9. Alan DeKok.
Thanks guys... I will find the answers to your questions... t happens infrequently enough, and goes away fast enough, to be difficult to debug... Mohamed. On Fri, Jul 24, 2015 at 6:38 AM, Alan DeKok <aland@deployingradius.com> wrote:
On Jul 24, 2015, at 1:34 AM, Mohamed Lrhazi <Mohamed.Lrhazi@georgetown.edu> wrote:
Still still trying to get to the bottom of this issue... to summarize: - Wireless controllers log that RADIUS server (a load balanced VIP), did not respond to a query. this is logged in clusters of dozen or so, several times a day. - Using docker containers.. so decided to try without them - Built two VMs, RedHat Enterprise 7, running provided freeradius RPMs. 3.0.4
Please use 3.0.9. We're not going to debug issues which were tracked down and fixed six months ago.
- Sending the quarter of our traffic to this pool of two VMs. - Issue still occurs on these VMs. - I run radiusd in -Xx mode, on both of the RHEL7 VMs, also run a continuous tcdpump, on each VM.
- Problem occurrences seem to reliably coincide with: -- tcpdump shows all the requests logged by the controllers having been resent few times (duplicates in wireshark). -- radiusd goes silent (no log at all) for 30 seconds. after which it resumes logging and I presume, working.
And.... what does the debug log say during this time? You should be able to correlate timestamps.
If there's *nothing* in the debug output, then most likely is that database is locking up, and preventing FreeRADIUS from doing anything
- radiusd logs a line for each missed query, I think, like so: Error: (7719) Ignoring duplicate packet from client gu_net_10 port 3010 - ID: 96 due to unfinished request in component <core> module
-- Spikes in CPU usage (as seen in sar output).
What can I do next? to further zoom in on the root cause? Or is this pretty clearly CPU starvation? just add more VMs ?
Use 3.0.9.
Alan DeKok.
- List info/subscribe/unsubscribe? See http://www.freeradius.org/list/users.html
Hello, So I am observing this issue now, with 3.0.8 (cant use 3.0.9 yet until I figure out another issue, discussed in other thread). I can observe this while running in -Xx mode (via a bash script that kills it evey 1 minute, and starts it anew, also starts annd stops tcpdump captures) When the issue occurs, I see for example in tcpdump packets arriving, then being resent as follows: 5804 16:35:29.443612 32770 10.128.254.50 10.212.11.14 1812 RADIUS 308 amc358 64 Access-Request(1) (id=64, l=266) 5806 16:35:29.494508 32770 10.128.254.50 10.212.11.14 1812 RADIUS 308 amc358 65 Access-Request(1) (id=65, l=266) 5808 16:35:29.622049 32770 10.128.254.50 10.212.11.14 1812 RADIUS 308 amc358 66 Access-Request(1) (id=66, l=266) 5810 16:35:29.717960 32770 10.128.254.50 10.212.11.14 1812 RADIUS 308 amc358 67 Access-Request(1) (id=67, l=266) 5812 16:35:29.813751 32770 10.128.254.50 10.212.11.14 1812 RADIUS 446 amc358 68 Access-Request(1) (id=68, l=404) 5814 16:35:29.837813 32770 10.128.254.50 10.212.11.14 1812 RADIUS 308 amc358 69 Access-Request(1) (id=69, l=266) 5816 16:35:29.856081 32770 10.128.254.50 10.212.11.14 1812 RADIUS 345 amc358 70 Access-Request(1) (id=70, l=303) 5818 16:35:29.882602 32770 10.128.254.50 10.212.11.14 1812 RADIUS 409 amc358 71 Access-Request(1) (id=71, l=367) 5824 16:35:29.938559 32770 10.128.254.50 10.212.11.14 1812 RADIUS 345 amc358 72 Access-Request(1) (id=72, l=303) 5832 16:35:29.962693 32770 10.128.254.50 10.212.11.14 1812 RADIUS 345 amc358 73 Access-Request(1) (id=73, l=303) * 6472 16:36:08.820646 32770 10.128.254.50 10.212.11.14 1812 RADIUS 295 amc358 182 Access-Request(1) (id=182, l=253) * 6478 16:36:10.923224 32770 10.128.254.50 10.212.11.14 1812 RADIUS 295 amc358 182 Access-Request(1) (id=182, l=253), Duplicate Request ID:182 6485 16:36:13.023196 32770 10.128.254.50 10.212.11.14 1812 RADIUS 295 amc358 182 Access-Request(1) (id=182, l=253), Duplicate Request ID:182 6492 16:36:15.123466 32770 10.128.254.50 10.212.11.14 1812 RADIUS 295 amc358 182 Access-Request(1) (id=182, l=253) 6500 16:36:17.187964 32770 10.128.254.50 10.212.11.14 1812 RADIUS 295 amc358 182 Access-Request(1) (id=182, l=253), Duplicate Request ID:182 6508 16:36:19.287626 32770 10.128.254.50 10.212.11.14 1812 RADIUS 295 amc358 182 Access-Request(1) (id=182, l=253), Duplicate Request ID:182 6520 16:36:21.388736 32770 10.128.254.50 10.212.11.14 1812 RADIUS 295 amc358 191 Access-Request(1) (id=191, l=253) 6550 16:36:23.492189 32770 10.128.254.50 10.212.11.14 1812 RADIUS 295 amc358 191 Access-Request(1) (id=191, l=253), Duplicate Request ID:191 6555 16:36:24.339371 32770 10.128.254.50 10.212.11.14 1812 RADIUS 295 amc358 196 Access-Request(1) (id=196, l=253) 6565 16:36:25.592138 32770 10.128.254.50 10.212.11.14 1812 RADIUS 295 amc358 191 Access-Request(1) (id=191, l=253), Duplicate Request ID:191 6571 16:36:26.439978 32770 10.128.254.50 10.212.11.14 1812 RADIUS 295 amc358 196 Access-Request(1) (id=196, l=253), Duplicate Request ID:196 6582 16:36:27.696882 32770 10.128.254.50 10.212.11.14 1812 RADIUS 295 amc358 191 Access-Request(1) (id=191, l=253) 6589 16:36:28.540430 32770 10.128.254.50 10.212.11.14 1812 RADIUS 295 amc358 196 Access-Request(1) (id=196, l=253), Duplicate Request ID:196 6602 16:36:29.796194 32770 10.128.254.50 10.212.11.14 1812 RADIUS 295 amc358 191 Access-Request(1) (id=191, l=253), Duplicate Request ID:191 6609 16:36:30.641936 32770 10.128.254.50 10.212.11.14 1812 RADIUS 295 amc358 196 Access-Request(1) (id=196, l=253) 6620 16:36:31.896351 32770 10.128.254.50 10.212.11.14 1812 RADIUS 295 amc358 191 Access-Request(1) (id=191, l=253), Duplicate Request ID:191 6628 16:36:32.745147 32770 10.128.254.50 10.212.11.14 1812 RADIUS 295 amc358 196 Access-Request(1) (id=196, l=253), Duplicate Request ID:196 6638 16:36:34.002058 32770 10.128.254.50 10.212.11.14 1812 RADIUS 295 amc358 207 Access-Request(1) (id=207, l=253) 6650 16:36:34.844618 32770 10.128.254.50 10.212.11.14 1812 RADIUS 295 amc358 196 Access-Request(1) (id=196, l=253), Duplicate Request ID:196 6657 16:36:36.100786 32770 10.128.254.50 10.212.11.14 1812 RADIUS 295 amc358 207 Access-Request(1) (id=207, l=253), Duplicate Request ID:207 6667 16:36:36.949503 32770 10.128.254.50 10.212.11.14 1812 RADIUS 295 amc358 211 Access-Request(1) (id=211, l=253) 6673 16:36:38.204572 32770 10.128.254.50 10.212.11.14 1812 RADIUS 295 amc358 207 Access-Request(1) (id=207, l=253), Duplicate Request ID:207 6863 16:36:39.048776 32770 10.128.254.50 10.212.11.14 1812 RADIUS 295 amc358 211 Access-Request(1) (id=211, l=253), Duplicate Request ID:211 6865 16:36:39.065787 32770 10.128.254.50 10.212.11.14 1812 RADIUS 308 amc358 236 Access-Request(1) (id=236, l=266) 6962 16:36:40.309559 32770 10.128.254.50 10.212.11.14 1812 RADIUS 295 amc358 207 Access-Request(1) (id=207, l=253) 7072 16:36:45.225124 32770 10.128.254.50 10.212.11.14 1812 RADIUS 295 amc358 25 Access-Request(1) (id=25, l=253) while in the debug output, I see that while the client is transmitting, there is no log at all of any activity from radiusd : Sun Jul 26 16:36:08 2015 : Debug: (1567) } # else = noop Sun Jul 26 16:36:08 2015 : Debug: (1567) } # policy remove_reply_message_if_eap = noop Sun Jul 26 16:36:08 2015 : Debug: (1567) } # Post-Auth-Type REJECT = updated Sun Jul 26 16:36:08 2015 : Debug: (1567) Sent Access-Reject Id 106 from 10.212.11.14:1812 to 10.128.254.50:32770 length 0 *Sun Jul 26 16:36:08 2015* : Debug: (1567) Finished request *Sun Jul 26 16:36:38 2015 *: Debug: PING: Zombie period is over for home server eduroam1 Sun Jul 26 16:36:38 2015 : Proxy: Marking home server 64.57.22.74 port 1812 as dead. Sun Jul 26 16:36:38 2015 : Debug: PING: Reviving home server eduroam1 in 300 seconds Sun Jul 26 16:36:38 2015 : Debug: (1702) <done>: Cleaning up request packet ID 180 with timestamp +281 Sun Jul 26 16:36:38 2015 : Debug: (1703) <done>: Cleaning up request packet ID 199 with timestamp +282 Sun Jul 26 16:36:38 2015 : Debug: (1704) <done>: Cleaning up request packet ID 200 with timestamp +282 Sun Jul 26 16:36:38 2015 : Debug: (1705) <done>: Cleaning up request packet ID 201 with timestamp +282 Sun Jul 26 16:36:38 2015 : Debug: (1706) <done>: Cleaning up request packet ID 202 with timestamp +282 Sun Jul 26 16:36:38 2015 : Debug: (1707) <done>: Cleaning up request packet ID 203 with timestamp +282 Sun Jul 26 16:36:38 2015 : Debug: (1708) <done>: Cleaning up request packet ID 204 with timestamp +282 Sun Jul 26 16:36:38 2015 : Debug: (1709) <done>: Cleaning up request packet ID 205 with timestamp +282 Sun Jul 26 16:36:38 2015 : Debug: (1710) <done>: Cleaning up request packet ID 206 with timestamp +283 Sun Jul 26 16:36:38 2015 : Debug: (1711) <done>: Cleaning up request packet ID 207 with timestamp +283 Sun Jul 26 16:36:38 2015 : Debug: (1712) <done>: Cleaning up request packet ID 208 with timestamp +283 Sun Jul 26 16:36:38 2015 : Debug: (1713) <done>: Cleaning up request packet ID 209 with timestamp +283 Sun Jul 26 16:36:38 2015 : Debug: (1714) <done>: Cleaning up request packet ID 210 with timestamp +283 Sun Jul 26 16:36:38 2015 : Debug: (1715) <done>: Cleaning up request packet ID 211 with timestamp +283 Sun Jul 26 16:36:38 2015 : Debug: (1716) <delay>: Cleaning up request packet ID 180 with timestamp +283 Sun Jul 26 16:36:38 2015 : Debug: (1567) <done>: Cleaning up request packet ID 106 with timestamp +255 Sun Jul 26 16:36:38 2015 : Debug: Waking up in 299.9 seconds. Sun Jul 26 16:36:38 2015 : Debug: (1717) Received Access-Request Id 181 from 10.128.254.50:32770 to 10.212.11.14:1812 length 285 ... Sun Jul 26 16:36:38 2015 : Debug: (1717) Message-Authenticator = 0x00000000000000000000000000000000 Sun Jul 26 16:36:38 2015 : Debug: (1717) State = 0x8a28e3f68a2ae7f253f84d3656e9a63d Sun Jul 26 16:36:38 2015 : Debug: (1717) Finished request Sun Jul 26 16:36:38 2015 : Debug: Waking up in 4.9 seconds. *Sun Jul 26 16:36:38 2015 : Debug: (1718) Received Access-Request Id 182 from 10.128.254.50:32770 <http://10.128.254.50:32770> to 10.212.11.14:1812 <http://10.212.11.14:1812> length 253* *Sun Jul 26 16:36:38 2015 : Debug: (1718) User-Name = 'amc358'* Sun Jul 26 16:36:38 2015 : Debug: (1718) Chargeable-User-Identity = 0x00 ... Sun Jul 26 16:36:38 2015 : Debug: (1718) } # authenticate = handled Sun Jul 26 16:36:38 2015 : Debug: (1718) Using Post-Auth-Type Challenge Sun Jul 26 16:36:38 2015 : Debug: (1718) Post-Auth-Type sub-section not found. Ignoring. Sun Jul 26 16:36:38 2015 : Debug: (1718) # Executing group from file /etc/raddb/sites-enabled/default Sun Jul 26 16:36:38 2015 : Debug: (1718) session-state: Nothing to cache Sun Jul 26 16:36:38 2015 : Debug: (1718) Sent Access-Challenge Id 182 from 10.212.11.14:1812 to 10.128.254.50:32770 length 0 Sun Jul 26 16:36:38 2015 : Debug: (1718) EAP-Message = 0x0102001604102666c3f0a4e6c47af22d4befc162cf78 Sun Jul 26 16:36:38 2015 : Debug: (1718) Message-Authenticator = 0x00000000000000000000000000000000 Sun Jul 26 16:36:38 2015 : Debug: (1718) State = 0x620ca86c620eace0c9c0fc432ad09a6a Sun Jul 26 16:36:38 2015 : Debug: (1718) Finished request Sun Jul 26 16:36:38 2015 : Debug: Waking up in 4.9 seconds. The system load on the VM during the entire time is never higher than 0.9. What else can I collect for data at this point? Thanks a lot, Mohamed. On Fri, Jul 24, 2015 at 6:38 AM, Alan DeKok <aland@deployingradius.com> wrote:
On Jul 24, 2015, at 1:34 AM, Mohamed Lrhazi <Mohamed.Lrhazi@georgetown.edu> wrote:
Still still trying to get to the bottom of this issue... to summarize: - Wireless controllers log that RADIUS server (a load balanced VIP), did not respond to a query. this is logged in clusters of dozen or so, several times a day. - Using docker containers.. so decided to try without them - Built two VMs, RedHat Enterprise 7, running provided freeradius RPMs. 3.0.4
Please use 3.0.9. We're not going to debug issues which were tracked down and fixed six months ago.
- Sending the quarter of our traffic to this pool of two VMs. - Issue still occurs on these VMs. - I run radiusd in -Xx mode, on both of the RHEL7 VMs, also run a continuous tcdpump, on each VM.
- Problem occurrences seem to reliably coincide with: -- tcpdump shows all the requests logged by the controllers having been resent few times (duplicates in wireshark). -- radiusd goes silent (no log at all) for 30 seconds. after which it resumes logging and I presume, working.
And.... what does the debug log say during this time? You should be able to correlate timestamps.
If there's *nothing* in the debug output, then most likely is that database is locking up, and preventing FreeRADIUS from doing anything
- radiusd logs a line for each missed query, I think, like so: Error: (7719) Ignoring duplicate packet from client gu_net_10 port 3010 - ID: 96 due to unfinished request in component <core> module
-- Spikes in CPU usage (as seen in sar output).
What can I do next? to further zoom in on the root cause? Or is this pretty clearly CPU starvation? just add more VMs ?
Use 3.0.9.
Alan DeKok.
- List info/subscribe/unsubscribe? See http://www.freeradius.org/list/users.html
Oh, Alan. B suggested strace... I'll see how I can grab that... I am sure I could not possibly run radiusd under tracing the whole time right? On Sun, Jul 26, 2015 at 6:36 PM, Mohamed Lrhazi < Mohamed.Lrhazi@georgetown.edu> wrote:
I can observe this while running in -Xx mode (via a bash script that kills
it evey 1 minute, and starts it anew, also starts annd stops tcpdump captures)
No, every 3600 seconds, actually. Sorry.
I installed collected on this system, and the one metric that seems to spike at the same time as the issue, is PsPageFaults for radiusd process. On Sun, Jul 26, 2015 at 6:41 PM, Mohamed Lrhazi < Mohamed.Lrhazi@georgetown.edu> wrote:
Oh, Alan. B suggested strace... I'll see how I can grab that... I am sure I could not possibly run radiusd under tracing the whole time right?
On Sun, Jul 26, 2015 at 6:36 PM, Mohamed Lrhazi < Mohamed.Lrhazi@georgetown.edu> wrote:
I can observe this while running in -Xx mode (via a bash script that
kills it evey 1 minute, and starts it anew, also starts annd stops tcpdump captures)
No, every 3600 seconds, actually. Sorry.
PsPageFaults spikes for radiusd process, coinciding with the issue. On Sun, Jul 26, 2015 at 6:52 PM, Mohamed Lrhazi < Mohamed.Lrhazi@georgetown.edu> wrote:
I installed collected on this system, and the one metric that seems to spike at the same time as the issue, is PsPageFaults for radiusd process.
On Sun, Jul 26, 2015 at 6:41 PM, Mohamed Lrhazi < Mohamed.Lrhazi@georgetown.edu> wrote:
Oh, Alan. B suggested strace... I'll see how I can grab that... I am sure I could not possibly run radiusd under tracing the whole time right?
On Sun, Jul 26, 2015 at 6:36 PM, Mohamed Lrhazi < Mohamed.Lrhazi@georgetown.edu> wrote:
I can observe this while running in -Xx mode (via a bash script that
kills it evey 1 minute, and starts it anew, also starts annd stops tcpdump captures)
No, every 3600 seconds, actually. Sorry.
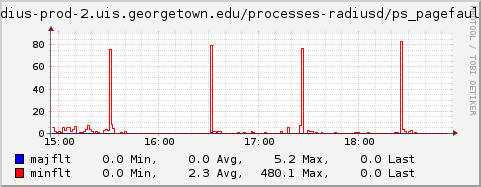
so, I run radiusd -Xx under strace... and it looks like I caught the event... not sure what to make of strace though : This is from the radiusd log: Mon Jul 27 21:54:39 2015 : Debug: (31451) } # Post-Auth-Type REJECT = updated Mon Jul 27 21:54:39 2015 : Debug: (31451) Sent Access-Reject Id 250 from 10.212.11.14:1812 to 10.128.254.52:32770 length 0 *Mon Jul 27 21:54:39 2015 :* Debug: (31451) Finished request *Mon Jul 27 21:55:09 2015 :* Debug: PING: Zombie period is over for home server eduroam1 Mon Jul 27 21:55:09 2015 : Proxy: Marking home server 64.57.22.74 port 1812 as dead. Mon Jul 27 21:55:09 2015 : Debug: PING: Reviving home server eduroam1 in 300 seconds Mon Jul 27 21:55:09 2015 : Debug: (31664) <done>: Cleaning up request packet ID 71 with timestamp +4030 Mon Jul 27 21:55:09 2015 : Debug: (31665) <done>: Cleaning up request packet ID 72 with timestamp +4030 Mon Jul 27 21:55:09 2015 : Debug: (31666) <done>: Cleaning up request packet ID 73 with timestamp +4030 Mon Jul 27 21:55:09 2015 : Debug: (31667) <done>: Cleaning up request packet ID 74 with timestamp +4030 Mon Jul 27 21:55:09 2015 : Debug: (31759) <delay>: Sending delayed response Mon Jul 27 21:55:09 2015 : Debug: (31759) <delay>: Sent Access-Reject Id 208 from 10.212.11.14:1812 to 10.128.254.50:32770 length 20 and this from the strace: 21:54:39.637272 write(3, "Mon Jul 27 21:54:39 2015 : Debug"..., 64) = 64 21:54:39.637307 write(3, "Mon Jul 27 21:54:39 2015 : Debug"..., 64) = 64 21:54:39.637343 write(3, "Mon Jul 27 21:54:39 2015 : Debug"..., 92) = 92 21:54:39.637379 write(3, "Mon Jul 27 21:54:39 2015 : Debug"..., 80) = 80 21:54:39.637426 write(3, "Mon Jul 27 21:54:39 2015 : Debug"..., 123) = 123 21:54:39.637476 sendmsg(26, {msg_name(16)={sa_family=AF_INET, sin_port=htons(32770), sin_addr=inet_addr("10.128.254.52")}, msg_iov(1)=[{"\3\372\0\24\331\36sKR)\216\23?\263.\17\356#pR", 20}], msg_controllen=32, {cmsg_len=28, cmsg_level=SOL_IP, cmsg_type=, ...}, msg_flags=0}, 0) = 20 21:54:39.637593 write(3, "Mon Jul 27 21:54:39 2015 : Debug"..., 59) = 59 *21:54:39.637630 *wait4(-1, NULL, WNOHANG, NULL) = -1 ECHILD (No child processes) *21:55:09.500134* write(3, "Mon Jul 27 21:55:09 2015 : Debug"..., 87) = 87 21:55:09.500311 write(3, "Mon Jul 27 21:55:09 2015 : Proxy"..., 85) = 85 21:55:09.500369 write(3, "Mon Jul 27 21:55:09 2015 : Debug"..., 85) = 85 21:55:09.500431 write(3, "Mon Jul 27 21:55:09 2015 : Debug"..., 104) = 104 and it does look like each time this "freeze" happens, it takes exactly 30 seconds? Thanks, Mohamed. On Sun, Jul 26, 2015 at 6:57 PM, Mohamed Lrhazi < Mohamed.Lrhazi@georgetown.edu> wrote:
PsPageFaults spikes for radiusd process, coinciding with the issue.
On Sun, Jul 26, 2015 at 6:52 PM, Mohamed Lrhazi < Mohamed.Lrhazi@georgetown.edu> wrote:
I installed collected on this system, and the one metric that seems to spike at the same time as the issue, is PsPageFaults for radiusd process.
On Sun, Jul 26, 2015 at 6:41 PM, Mohamed Lrhazi < Mohamed.Lrhazi@georgetown.edu> wrote:
Oh, Alan. B suggested strace... I'll see how I can grab that... I am sure I could not possibly run radiusd under tracing the whole time right?
On Sun, Jul 26, 2015 at 6:36 PM, Mohamed Lrhazi < Mohamed.Lrhazi@georgetown.edu> wrote:
I can observe this while running in -Xx mode (via a bash script that
kills it evey 1 minute, and starts it anew, also starts annd stops tcpdump captures)
No, every 3600 seconds, actually. Sorry.
Here is the similar trace, with -T, for logging the time each syscall took.. and apparently none actually took the missing 30 seconds!! 18916 08:38:42.908889 write(3, "Tue Jul 28 08:38:42 2015 : Debug"..., 92) = 92 <0.000010> 18916 08:38:42.908937 write(3, "Tue Jul 28 08:38:42 2015 : Debug"..., 80) = 80 <0.000009> 18916 08:38:42.908982 write(3, "Tue Jul 28 08:38:42 2015 : Debug"..., 122) = 122 <0.000009> 18916 08:38:42.909023 sendmsg(26, {msg_name(16)={sa_family=AF_INET, sin_port=htons(32770), sin_addr=inet_addr("10.128.254.50")}, msg_iov(1)=[{"\3\37\0\24\3558.7c\261yC\325\344+I\257\271\234\215", 20}], msg_controllen=32, {cmsg_len=28, cmsg_level=SOL_IP, cmsg_type=, ...}, msg_flags=0}, 0) = 20 <0.000056> 18916 08:38:42.909134 write(3, "Tue Jul 28 08:38:42 2015 : Debug"..., 59) = 59 <0.000011> 18916 *08:38:42.909176* wait4(-1, NULL, WNOHANG, NULL) = -1 ECHILD (No child processes) <*0.000019*> 18916 *08:39:12.500099 *write(3, "Tue Jul 28 08:39:12 2015 : Debug"..., 87) = 87 <0.000017> 18916 08:39:12.500222 write(3, "Tue Jul 28 08:39:12 2015 : Proxy"..., 85) = 85 <0.000011> 18916 08:39:12.500274 write(3, "Tue Jul 28 08:39:12 2015 : Debug"..., 85) = 85 <0.000010> On Mon, Jul 27, 2015 at 11:07 PM, Mohamed Lrhazi < Mohamed.Lrhazi@georgetown.edu> wrote:
so, I run radiusd -Xx under strace... and it looks like I caught the event... not sure what to make of strace though :
This is from the radiusd log:
Mon Jul 27 21:54:39 2015 : Debug: (31451) } # Post-Auth-Type REJECT = updated Mon Jul 27 21:54:39 2015 : Debug: (31451) Sent Access-Reject Id 250 from 10.212.11.14:1812 to 10.128.254.52:32770 length 0 *Mon Jul 27 21:54:39 2015 :* Debug: (31451) Finished request *Mon Jul 27 21:55:09 2015 :* Debug: PING: Zombie period is over for home server eduroam1 Mon Jul 27 21:55:09 2015 : Proxy: Marking home server 64.57.22.74 port 1812 as dead. Mon Jul 27 21:55:09 2015 : Debug: PING: Reviving home server eduroam1 in 300 seconds Mon Jul 27 21:55:09 2015 : Debug: (31664) <done>: Cleaning up request packet ID 71 with timestamp +4030 Mon Jul 27 21:55:09 2015 : Debug: (31665) <done>: Cleaning up request packet ID 72 with timestamp +4030 Mon Jul 27 21:55:09 2015 : Debug: (31666) <done>: Cleaning up request packet ID 73 with timestamp +4030 Mon Jul 27 21:55:09 2015 : Debug: (31667) <done>: Cleaning up request packet ID 74 with timestamp +4030 Mon Jul 27 21:55:09 2015 : Debug: (31759) <delay>: Sending delayed response Mon Jul 27 21:55:09 2015 : Debug: (31759) <delay>: Sent Access-Reject Id 208 from 10.212.11.14:1812 to 10.128.254.50:32770 length 20
and this from the strace:
21:54:39.637272 write(3, "Mon Jul 27 21:54:39 2015 : Debug"..., 64) = 64 21:54:39.637307 write(3, "Mon Jul 27 21:54:39 2015 : Debug"..., 64) = 64 21:54:39.637343 write(3, "Mon Jul 27 21:54:39 2015 : Debug"..., 92) = 92 21:54:39.637379 write(3, "Mon Jul 27 21:54:39 2015 : Debug"..., 80) = 80 21:54:39.637426 write(3, "Mon Jul 27 21:54:39 2015 : Debug"..., 123) = 123 21:54:39.637476 sendmsg(26, {msg_name(16)={sa_family=AF_INET, sin_port=htons(32770), sin_addr=inet_addr("10.128.254.52")}, msg_iov(1)=[{"\3\372\0\24\331\36sKR)\216\23?\263.\17\356#pR", 20}], msg_controllen=32, {cmsg_len=28, cmsg_level=SOL_IP, cmsg_type=, ...}, msg_flags=0}, 0) = 20 21:54:39.637593 write(3, "Mon Jul 27 21:54:39 2015 : Debug"..., 59) = 59 *21:54:39.637630 *wait4(-1, NULL, WNOHANG, NULL) = -1 ECHILD (No child processes) *21:55:09.500134* write(3, "Mon Jul 27 21:55:09 2015 : Debug"..., 87) = 87 21:55:09.500311 write(3, "Mon Jul 27 21:55:09 2015 : Proxy"..., 85) = 85 21:55:09.500369 write(3, "Mon Jul 27 21:55:09 2015 : Debug"..., 85) = 85 21:55:09.500431 write(3, "Mon Jul 27 21:55:09 2015 : Debug"..., 104) = 104
and it does look like each time this "freeze" happens, it takes exactly 30 seconds?
Thanks, Mohamed.
On Sun, Jul 26, 2015 at 6:57 PM, Mohamed Lrhazi < Mohamed.Lrhazi@georgetown.edu> wrote:
PsPageFaults spikes for radiusd process, coinciding with the issue.
On Sun, Jul 26, 2015 at 6:52 PM, Mohamed Lrhazi < Mohamed.Lrhazi@georgetown.edu> wrote:
I installed collected on this system, and the one metric that seems to spike at the same time as the issue, is PsPageFaults for radiusd process.
On Sun, Jul 26, 2015 at 6:41 PM, Mohamed Lrhazi < Mohamed.Lrhazi@georgetown.edu> wrote:
Oh, Alan. B suggested strace... I'll see how I can grab that... I am sure I could not possibly run radiusd under tracing the whole time right?
On Sun, Jul 26, 2015 at 6:36 PM, Mohamed Lrhazi < Mohamed.Lrhazi@georgetown.edu> wrote:
I can observe this while running in -Xx mode (via a bash script that
kills it evey 1 minute, and starts it anew, also starts annd stops tcpdump captures)
No, every 3600 seconds, actually. Sorry.
Can slowness of a remote server (eduroam in this case) cause this behavior am observing here? where the whole radiusd seems to freeze up for 30 seconds? I've been looking at my LDAP server logs, and do not find signs of any issues, no requests seem to have taken more than a second (no sub second timestamps in the logs).... Thanks, Mohamed. On Tue, Jul 28, 2015 at 10:28 AM, Mohamed Lrhazi < Mohamed.Lrhazi@georgetown.edu> wrote:
Here is the similar trace, with -T, for logging the time each syscall took.. and apparently none actually took the missing 30 seconds!!
18916 08:38:42.908889 write(3, "Tue Jul 28 08:38:42 2015 : Debug"..., 92) = 92 <0.000010> 18916 08:38:42.908937 write(3, "Tue Jul 28 08:38:42 2015 : Debug"..., 80) = 80 <0.000009> 18916 08:38:42.908982 write(3, "Tue Jul 28 08:38:42 2015 : Debug"..., 122) = 122 <0.000009> 18916 08:38:42.909023 sendmsg(26, {msg_name(16)={sa_family=AF_INET, sin_port=htons(32770), sin_addr=inet_addr("10.128.254.50")}, msg_iov(1)=[{"\3\37\0\24\3558.7c\261yC\325\344+I\257\271\234\215", 20}], msg_controllen=32, {cmsg_len=28, cmsg_level=SOL_IP, cmsg_type=, ...}, msg_flags=0}, 0) = 20 <0.000056> 18916 08:38:42.909134 write(3, "Tue Jul 28 08:38:42 2015 : Debug"..., 59) = 59 <0.000011> 18916 *08:38:42.909176* wait4(-1, NULL, WNOHANG, NULL) = -1 ECHILD (No child processes) <*0.000019*> 18916 *08:39:12.500099 *write(3, "Tue Jul 28 08:39:12 2015 : Debug"..., 87) = 87 <0.000017> 18916 08:39:12.500222 write(3, "Tue Jul 28 08:39:12 2015 : Proxy"..., 85) = 85 <0.000011> 18916 08:39:12.500274 write(3, "Tue Jul 28 08:39:12 2015 : Debug"..., 85) = 85 <0.000010>
On Mon, Jul 27, 2015 at 11:07 PM, Mohamed Lrhazi < Mohamed.Lrhazi@georgetown.edu> wrote:
so, I run radiusd -Xx under strace... and it looks like I caught the event... not sure what to make of strace though :
This is from the radiusd log:
Mon Jul 27 21:54:39 2015 : Debug: (31451) } # Post-Auth-Type REJECT = updated Mon Jul 27 21:54:39 2015 : Debug: (31451) Sent Access-Reject Id 250 from 10.212.11.14:1812 to 10.128.254.52:32770 length 0 *Mon Jul 27 21:54:39 2015 :* Debug: (31451) Finished request *Mon Jul 27 21:55:09 2015 :* Debug: PING: Zombie period is over for home server eduroam1 Mon Jul 27 21:55:09 2015 : Proxy: Marking home server 64.57.22.74 port 1812 as dead. Mon Jul 27 21:55:09 2015 : Debug: PING: Reviving home server eduroam1 in 300 seconds Mon Jul 27 21:55:09 2015 : Debug: (31664) <done>: Cleaning up request packet ID 71 with timestamp +4030 Mon Jul 27 21:55:09 2015 : Debug: (31665) <done>: Cleaning up request packet ID 72 with timestamp +4030 Mon Jul 27 21:55:09 2015 : Debug: (31666) <done>: Cleaning up request packet ID 73 with timestamp +4030 Mon Jul 27 21:55:09 2015 : Debug: (31667) <done>: Cleaning up request packet ID 74 with timestamp +4030 Mon Jul 27 21:55:09 2015 : Debug: (31759) <delay>: Sending delayed response Mon Jul 27 21:55:09 2015 : Debug: (31759) <delay>: Sent Access-Reject Id 208 from 10.212.11.14:1812 to 10.128.254.50:32770 length 20
and this from the strace:
21:54:39.637272 write(3, "Mon Jul 27 21:54:39 2015 : Debug"..., 64) = 64 21:54:39.637307 write(3, "Mon Jul 27 21:54:39 2015 : Debug"..., 64) = 64 21:54:39.637343 write(3, "Mon Jul 27 21:54:39 2015 : Debug"..., 92) = 92 21:54:39.637379 write(3, "Mon Jul 27 21:54:39 2015 : Debug"..., 80) = 80 21:54:39.637426 write(3, "Mon Jul 27 21:54:39 2015 : Debug"..., 123) = 123 21:54:39.637476 sendmsg(26, {msg_name(16)={sa_family=AF_INET, sin_port=htons(32770), sin_addr=inet_addr("10.128.254.52")}, msg_iov(1)=[{"\3\372\0\24\331\36sKR)\216\23?\263.\17\356#pR", 20}], msg_controllen=32, {cmsg_len=28, cmsg_level=SOL_IP, cmsg_type=, ...}, msg_flags=0}, 0) = 20 21:54:39.637593 write(3, "Mon Jul 27 21:54:39 2015 : Debug"..., 59) = 59 *21:54:39.637630 *wait4(-1, NULL, WNOHANG, NULL) = -1 ECHILD (No child processes) *21:55:09.500134* write(3, "Mon Jul 27 21:55:09 2015 : Debug"..., 87) = 87 21:55:09.500311 write(3, "Mon Jul 27 21:55:09 2015 : Proxy"..., 85) = 85 21:55:09.500369 write(3, "Mon Jul 27 21:55:09 2015 : Debug"..., 85) = 85 21:55:09.500431 write(3, "Mon Jul 27 21:55:09 2015 : Debug"..., 104) = 104
and it does look like each time this "freeze" happens, it takes exactly 30 seconds?
Thanks, Mohamed.
On Sun, Jul 26, 2015 at 6:57 PM, Mohamed Lrhazi < Mohamed.Lrhazi@georgetown.edu> wrote:
PsPageFaults spikes for radiusd process, coinciding with the issue.
On Sun, Jul 26, 2015 at 6:52 PM, Mohamed Lrhazi < Mohamed.Lrhazi@georgetown.edu> wrote:
I installed collected on this system, and the one metric that seems to spike at the same time as the issue, is PsPageFaults for radiusd process.
On Sun, Jul 26, 2015 at 6:41 PM, Mohamed Lrhazi < Mohamed.Lrhazi@georgetown.edu> wrote:
Oh, Alan. B suggested strace... I'll see how I can grab that... I am sure I could not possibly run radiusd under tracing the whole time right?
On Sun, Jul 26, 2015 at 6:36 PM, Mohamed Lrhazi < Mohamed.Lrhazi@georgetown.edu> wrote:
I can observe this while running in -Xx mode (via a bash script that > kills it evey 1 minute, and starts it anew, also starts annd stops tcpdump > captures)
No, every 3600 seconds, actually. Sorry.
Hi,
Can slowness of a remote server (eduroam in this case) cause this behavior am observing here? where the whole radiusd seems to freeze up for 30 seconds? I've been looking at my LDAP server logs, and do not find signs of any issues, no requests seem to have taken more than a second (no sub second timestamps in the logs)....
for remote servers that you may proxy to, use 'Status-Server' - that way the server knows if its alive/responding rather than unable to deal with a request... if you think its remote proxy...are you running in full debug mode..and what do you see happenign on the wire (eg with tcpdump) when this happens? alan
My radius server receives traffic from cisco wireless controllers.. and does one of two things: Authenticate requests for our local users, via our LDAP servers, and forward non local users to eduroam servers. What I notice is that the cisco controllers log, every now and then, that requests (for user X, with request-id Y) timed out. The radius server, now 3.0.8, is running in full debug mode, under strace. along with continuous tcpdump. (strace radiusd and tcpdump restarting once per hour to minimize the log size per file). Now, when the cisco logs time outs... I can find the specific request-ids in the pcap. It has been resent many times in the course of 30 seconds or so. In the debug output, I notice the requests being handled (received) late, way after cisco had re-transmitted many times and timedout. I noticed that these timeout event seem to coicide pefectly with 30 second gaps in the radiusd log, like so: Mon Jul 27 21:54:39 2015 : Debug: (31451) } # Post-Auth-Type REJECT = updated Mon Jul 27 21:54:39 2015 : Debug: (31451) Sent Access-Reject Id 250 from 10.212.11.14:1812 to 10.128.254.52:32770 length 0 *Mon Jul 27 21:54:39 2015 :* Debug: (31451) Finished request *Mon Jul 27 21:55:09 2015 :* Debug: PING: Zombie period is over for home server eduroam1 Mon Jul 27 21:55:09 2015 : Proxy: Marking home server 64.57.22.74 port 1812 as dead. The time between the two bold lines is when cisco logged many timeouts. I also notice frequent errors about eduroam servers having been marked down, failed to reply... not sure if this is actually the root cause... So, am wondering... what could cause radiusd to freeze for 30 seconds? if that is what's happening here... how do I dig more if that is not the case? Strace seems to show the same missing 30 seconds (though this log is from different occurrence): 18916 08:38:42.909134 write(3, "Tue Jul 28 08:38:42 2015 : Debug"..., 59) = 59 <0.000011> 18916 *08:38:42.909176* wait4(-1, NULL, WNOHANG, NULL) = -1 ECHILD (No child processes) <*0.000019*> 18916 *08:39:12.500099 *write(3, "Tue Jul 28 08:39:12 2015 : Debug"..., 87) = 87 <0.000017> 18916 08:39:12.500222 write(3, "Tue Jul 28 08:39:12 2015 : Proxy"..., 85) = 85 <0.000011> Note that the cisco logs are not always about local users, or always about non local users... but both. radius server just seems to go completely unresponsive for a while.... Thanks a lot, Mohamed. On Tue, Jul 28, 2015 at 3:55 PM, <A.L.M.Buxey@lboro.ac.uk> wrote:
Hi,
Can slowness of a remote server (eduroam in this case) cause this behavior am observing here? where the whole radiusd seems to freeze up for 30 seconds? I've been looking at my LDAP server logs, and do not find signs of any issues, no requests seem to have taken more than a second (no sub second timestamps in the logs)....
for remote servers that you may proxy to, use 'Status-Server' - that way the server knows if its alive/responding rather than unable to deal with a request...
if you think its remote proxy...are you running in full debug mode..and what do you see happenign on the wire (eg with tcpdump) when this happens?
alan
- List info/subscribe/unsubscribe? See http://www.freeradius.org/list/users.html
I'll repeat Use status-server I would also ask your eduroam NRO administrator what they see at their end from you as i doubt this is occurring for ALL your remote user auths...and check your proxy policy to ensure only those requests that SHOULD be going up to the national level servers are. alan
I am not sure I understand... you're saying enable the status-server ( http://wiki.freeradius.org/config/Status) and then query it during this "freeze" times to see if it responds? or make my Cisco clients use it to check the server health? I will contact our eduroam guys and find out more... my question was whether or not not an issue with remote proxies not responding could, in principal, cause the behavior I am seeing (radiusd completely freezes up, does not log anything, does not receive any new packets... for 30 seconds) Thanks a lot, Mohamed. On Wed, Jul 29, 2015 at 2:31 AM, Alan Buxey <A.L.M.Buxey@lboro.ac.uk> wrote:
I'll repeat
Use status-server
I would also ask your eduroam NRO administrator what they see at their end from you as i doubt this is occurring for ALL your remote user auths...and check your proxy policy to ensure only those requests that SHOULD be going up to the national level servers are.
alan
You do know what running radiusd in full debug mode does to the server (hint *single thread*) ? If your kit supports status-server then is recommend that you use it. ...but i meant for the connecting between your server and the upstream proxies as if you send a request to them that they send to another system and that other system doesn't respond then you won't get a response. ..the remote proxy doesn't respond autonomously. ...That's why you need to use status-server Also. We are you doing regarding accounting? Your kit is sending radius accounting to your server? Perhaps you are looking in the wrong place and it's the accounting stuff that's causing lack of response from your server alan
On Wed, Jul 29, 2015 at 3:45 AM, Alan Buxey <A.L.M.Buxey@lboro.ac.uk> wrote:
You do know what running radiusd in full debug mode does to the server (hint *single thread*) ?
Wow! No, I did not know!!!! Lots of what I thought I learned about the issue... well, was no learning at all... OK. back to square one. I will educate myself on the server-status and see how I can use it. Regarding accounting, I never used it.. Our firewall and load balancer are not setup to expect it either. the error from the wireless controllers seems to be about actual user authentication though : Jul 29 01:58:11 [local0.warning] TRB-WLAN-WISM9: *radiusTransportThread: Jul 29 01:58:11.204: #AAA-4-RADIUS_RESPONSE_FAILED: [PA] radius_db.c:504 RADIUS server 192.166.226.11:1812 failed to respond to request(ID 120) for STA XX:XX:XX:30:8d:6f / user 'xre29' Thanks a lot, Mohamed.
Hello, So I wrote a little bash script to try and detect the event, so as to try and launch some commands to further debug... It seems to be able to catch it... currently it just run a server-status request, sleep 5, run server-status again, then run "top" command... Please see output bellow. The way the script works is by simply running "tcpdump port 1812" for 10 seconds and try to detect if we received RADIUS requests and we did not reply to any. In this occurrence, the server seems to have failed to reply to the status command twice... top shows that system load was never high. I guess next would be to run raddedug in such a moment? Any suggestions on other data I would want to grab, that can help identify why radiusd locks up, or fails to respond? Wed Jul 29 10:10:22 EDT 2015 Sent Status-Server Id 221 from 0.0.0.0:38772 to 127.0.0.1:18121 length 50 Message-Authenticator = 0x00 FreeRADIUS-Statistics-Type = Authentication Response-Packet-Type = Access-Accept Sent Status-Server Id 221 from 0.0.0.0:38772 to 127.0.0.1:18121 length 50 Message-Authenticator = 0x00 FreeRADIUS-Statistics-Type = Authentication Response-Packet-Type = Access-Accept Sent Status-Server Id 221 from 0.0.0.0:38772 to 127.0.0.1:18121 length 50 Message-Authenticator = 0x00 FreeRADIUS-Statistics-Type = Authentication Response-Packet-Type = Access-Accept Received Access-Accept Id 221 from 127.0.0.1:18121 to 0.0.0.0:0 length 140 FreeRADIUS-Total-Access-Requests = 193666 FreeRADIUS-Total-Access-Accepts = 18043 FreeRADIUS-Total-Access-Rejects = 3102 FreeRADIUS-Total-Access-Challenges = 172407 FreeRADIUS-Total-Auth-Responses = 193552 FreeRADIUS-Total-Auth-Duplicate-Requests = 84 FreeRADIUS-Total-Auth-Malformed-Requests = 0 FreeRADIUS-Total-Auth-Invalid-Requests = 0 FreeRADIUS-Total-Auth-Dropped-Requests = 88 FreeRADIUS-Total-Auth-Unknown-Types = 0 Sent Status-Server Id 28 from 0.0.0.0:40187 to 127.0.0.1:18121 length 50 Message-Authenticator = 0x00 FreeRADIUS-Statistics-Type = Authentication Response-Packet-Type = Access-Accept Received Access-Accept Id 28 from 127.0.0.1:18121 to 0.0.0.0:0 length 140 FreeRADIUS-Total-Access-Requests = 194192 FreeRADIUS-Total-Access-Accepts = 18044 FreeRADIUS-Total-Access-Rejects = 3107 FreeRADIUS-Total-Access-Challenges = 172443 FreeRADIUS-Total-Auth-Responses = 193594 FreeRADIUS-Total-Auth-Duplicate-Requests = 140 FreeRADIUS-Total-Auth-Malformed-Requests = 0 FreeRADIUS-Total-Auth-Invalid-Requests = 0 FreeRADIUS-Total-Auth-Dropped-Requests = 145 FreeRADIUS-Total-Auth-Unknown-Types = 0 top - 10:10:39 up 7 days, 10:42, 3 users, load average: 0.37, 0.12, 0.07 Tasks: 179 total, 1 running, 178 sleeping, 0 stopped, 0 zombie %Cpu(s): 0.5 us, 0.4 sy, 0.0 ni, 99.1 id, 0.0 wa, 0.0 hi, 0.0 si, 0.0 st KiB Mem : 1884696 total, 1368184 free, 165676 used, 350836 buff/cache KiB Swap: 4194300 total, 4117172 free, 77128 used. 1447748 avail Mem PID USER PR NI VIRT RES SHR S %CPU %MEM TIME+ COMMAND 25532 root 20 0 130032 1668 1200 R 5.9 0.1 0:00.02 top 1 root 20 0 206336 5048 2860 S 0.0 0.3 0:41.37 systemd 2 root 20 0 0 0 0 S 0.0 0.0 0:00.03 kthreadd 3 root 20 0 0 0 0 S 0.0 0.0 0:00.70 ksoftirqd/0 5 root 0 -20 0 0 0 S 0.0 0.0 0:00.00 kworker/0:0H 7 root rt 0 0 0 0 S 0.0 0.0 0:00.65 migration/0 ...
Yes, working on that too.. seems they see a lot of retrasmits on their end: Wed Jul 29 13:58:43 2015: INFO: Duplicate request id 135 received from 141.161.226.10(43546): retransmit reply Thanks, Mohamed. On Wed, Jul 29, 2015 at 1:03 PM, Alan Buxey <A.L.M.Buxey@lboro.ac.uk> wrote:
....and have you talked to your upstream operators yet?
alan
Still trying to figure out our eduroam frequent retrasmits and failures issues... in the mean time, I routed all our local users requests to one set of freeradius 3.0.8 servers, and eduroam ones to another.. The wireless controllers no more log any errors for our local users.. only eduroam users... I also found out our proxy config had : response_window = 30, which I changed to 10, and also set: status_check = status-server So, would this be a possible explanation to my original problem: - Processing a request that we send to a remote proxy, blocks a thread. If we have many such requests concurrently, we end up blocking all threads... Should I be able to find something in the logs when such an events happen? Thanks a lot, Mohamed. On Wed, Jul 29, 2015 at 4:15 PM, Mohamed Lrhazi < Mohamed.Lrhazi@georgetown.edu> wrote:
Yes, working on that too.. seems they see a lot of retrasmits on their end:
Wed Jul 29 13:58:43 2015: INFO: Duplicate request id 135 received from 141.161.226.10(43546): retransmit reply
Thanks, Mohamed.
On Wed, Jul 29, 2015 at 1:03 PM, Alan Buxey <A.L.M.Buxey@lboro.ac.uk> wrote:
....and have you talked to your upstream operators yet?
alan
How many threads are you running with? 64, 128? How many concurrent requests are you configured to deal with? Number of nas clientsx256 (remember that remote proxies are clients too)? In the end you need to deal with the source of your problem. You can hack at relieving the symptoms but you still have the disease to cure which may otherwise affect you in other ways. Talk with your upstream proxy server admins. Find where the issue is. ..firewall, NAT, wrong outbound address, incorrect shared secret etc etc. Fix that. And use status-server against them alan
Thanks a lot for all you support guys. Fixing our eduroam issue and tweaking thread pool is the plan. Mohamed. On Fri, Jul 31, 2015 at 12:15 PM, Alan Buxey <A.L.M.Buxey@lboro.ac.uk> wrote:
How many threads are you running with? 64, 128? How many concurrent requests are you configured to deal with? Number of nas clientsx256 (remember that remote proxies are clients too)?
In the end you need to deal with the source of your problem. You can hack at relieving the symptoms but you still have the disease to cure which may otherwise affect you in other ways. Talk with your upstream proxy server admins. Find where the issue is. ..firewall, NAT, wrong outbound address, incorrect shared secret etc etc. Fix that.
And use status-server against them
alan
On Jul 31, 2015, at 5:58 PM, Mohamed Lrhazi <Mohamed.Lrhazi@georgetown.edu> wrote:
So, would this be a possible explanation to my original problem:
- Processing a request that we send to a remote proxy, blocks a thread. If we have many such requests concurrently, we end up blocking all threads...
No. That is not how the server works. My guess is that you have something in the system which does DNS lookups, and the DNS server is down. That is the usual cause of 30 second lockups. Alan DeKok.
Thanks Alan, I will investigate that. From the network captures I had taken before, I did check for DNS and saw only the LDAP server name being queried for every so often... which itself indicates the system is not caching DNS, I'll fix that too, and keep this in mind if the issue re-appears. Thanks, Mohamed. On Sat, Aug 1, 2015 at 3:14 AM, Alan DeKok <aland@deployingradius.com> wrote:
On Jul 31, 2015, at 5:58 PM, Mohamed Lrhazi <Mohamed.Lrhazi@georgetown.edu> wrote:
So, would this be a possible explanation to my original problem:
- Processing a request that we send to a remote proxy, blocks a thread. If we have many such requests concurrently, we end up blocking all threads...
No. That is not how the server works.
My guess is that you have something in the system which does DNS lookups, and the DNS server is down. That is the usual cause of 30 second lockups.
Alan DeKok.
- List info/subscribe/unsubscribe? See http://www.freeradius.org/list/users.html
participants (5)
-
 A.L.M.Buxey@lboro.ac.uk
 -
 Adam Bishop
 -
Alan Buxey
-
 Alan DeKok
 -
 Mohamed Lrhazi